The next step is to quantify how many reads align to each gene. We will do this with a program called htseq-count.
First lets move to the directory with our alignment
cd ~/rna_tutorial/sample_data_for_alignment
Next we use the htseq-count program to count the number of reads from our BAM file that map to the positions of known genes in the GTF file for the reference genome.
htseq-count -f bam --stranded=yes Aligned.sortedByCoord.out.bam ../reference/Ataliana.gtf > test_sample.counts
Note that we also tell htseq-count program that our alignment data in is BAM format using the -f flag and that the library is ‘stranded’ using the --stranded flag. htseq will take a few minutes to run. You may even see a warning appear about missing aligned mates, these can be ignored for now and we will check our data makes sense later.
Most RNA sequencing is strand specific. This means that the cDNA created from the RNA and there-fore the sequenced read-pair occur in a particular orientation.
There are a few different protocols to create the cDNA library:
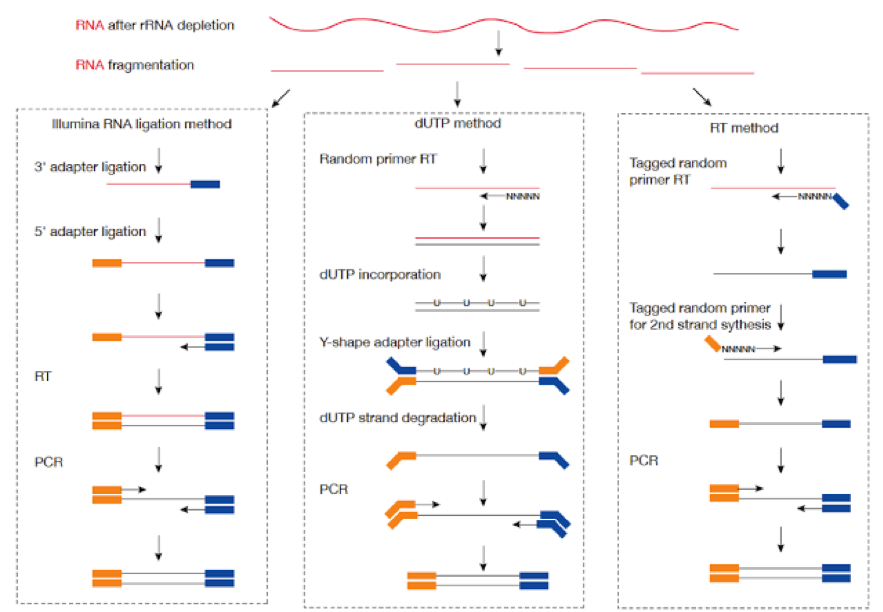
Depending on the library preparation method used, the patterns of primer layouts will look like this:
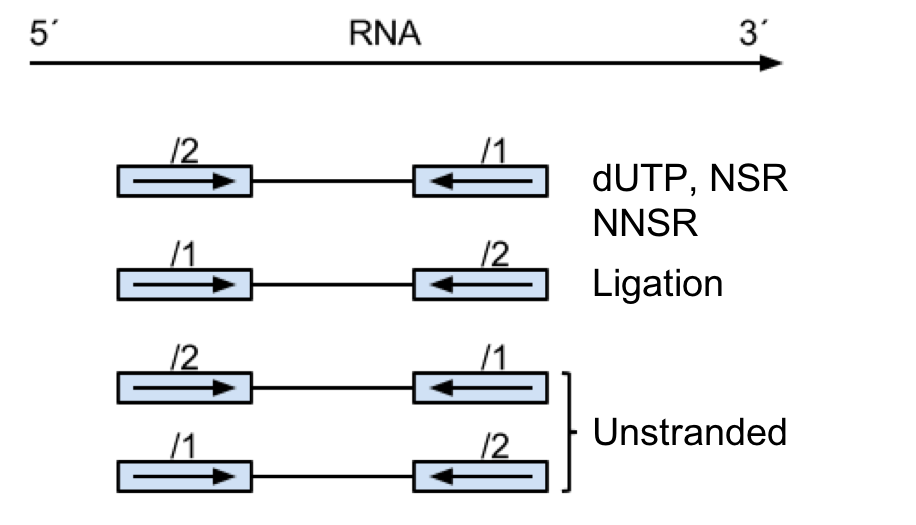
Therefore, the methods used to generate the cDNA library can have implications for the parameters used in its analysis.
This table shows some of the common library preparation methods and the parameters you would use in htseq-count.
| Library Type | htseq-count stranded |
|---|---|
| TruSeq Directional | –stranded=reverse |
| ScriptSeq/TotalSeq | –stranded=yes |
Note that the sequencing data we are using here was generated using the ScriptSeq protocol. However, most of the libraries created at the University of Exeter are now made with the TruSeq Directional protocol and therefore the setting you require will be different.
For some more detailed information you might want to have a look at this blog post.
Now that we have counted the number of reads that map to genes its always a good idea to have a quick look at the data and make sure there are no obvious problems.
Using the following unix commands, we can look at the most highly expressed genes
sort -nr -k 2 test_sample.counts | head -n 20
The output should look something like:
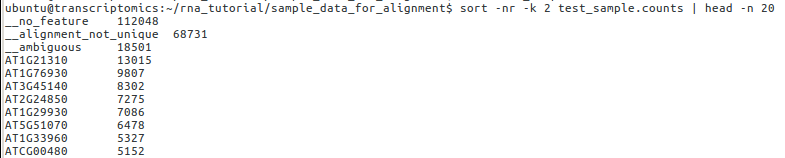
Here, we can see that ~100,000 reads map to no feature and ~68,000 alignments are not unique. Although this might seem like a problem, in actual fact only a very small percentage of our reads are not aligned to genes. Our alignment will never be perfect so these data seem fine for further analysis. We can even check some of the genes that occur frequently in our data; AT1G21310 encodes extensin-3, a component of the cell wall, so we might expect this to be highly expressed within our data. In practice, manually checking single genes is of little use, genome-wide comparisons across different conditions are much more informative.