Quality checking of Illumina fastq reads was covered in detail in the Genomics Workshop. Here we will only cover the aspects that are specific to RNA-Seq.
Change to a directory where we have a small subset of our sequencing data.
cd rna_tutorial/sample_data_for_alignment
ls -l
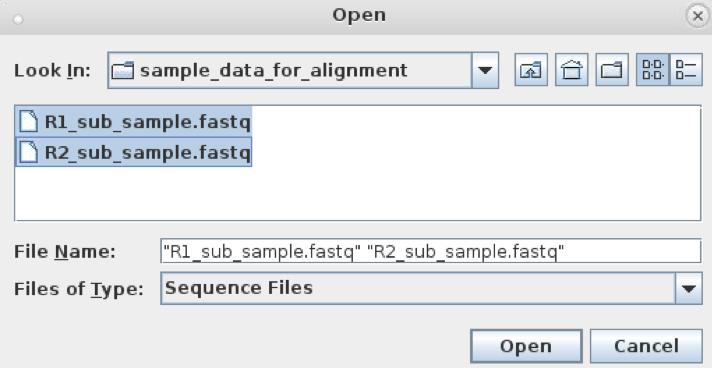
There are 2 files we’re interested in:
R1_sub_sample.fastq
R2_sub_sample_fastq
Next, and start the fastqc program
fastqc
After a few seconds the fastqc program will load in its own window. Select File then Open… from the fastqc menu and navigate to the rna_tutorial/sample_data_for_alignment directory.
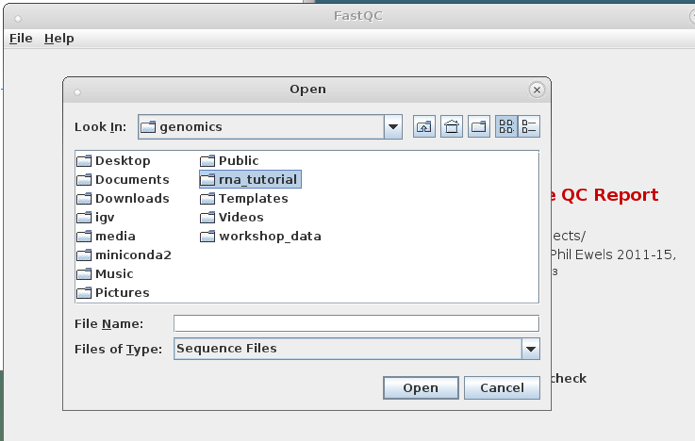
Select the 2 files and click Open.
This will generate a series of reports for uploaded fastq data. For a detailed description of these reports you can refer to the genomics tutorial on the FastQC website.
In this workshop we will just look at a few key reports.
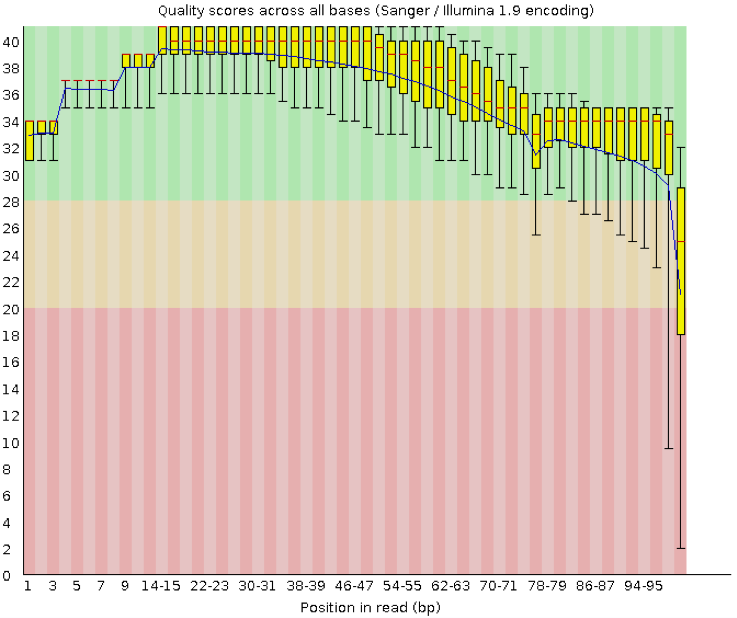
This is one of the most important metrics. This view shows an overview of the range of quality values across all bases at each position in the FASTQ file. To provide an estimate of confidence in a given base-call, the Illumina sequencing pipeline assigns a quality score to each base called. Most quality scores are calculated using the Phred scale. Each base call has an associated base call quality which estimates the chance that the base call is incorrect.
Generally anything with a median quality score greater than Q20 is regarded as acceptable; anything above Q30 is regarded as ‘good’.
The main difference to be aware of with FastQC of RNA-Seq reads is that the sequence duplication levels will naturally be higher than genomic sequencing.
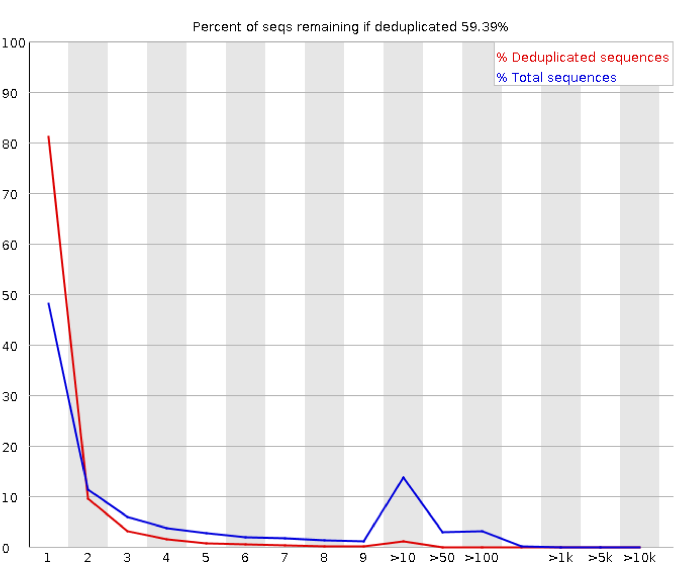
This module counts the degree of duplication for every sequence in the set and creates a plot showing the relative number of sequences with different degrees of duplication. The report suggests that 40% of our sequences are duplicates. This may well be flagged as a problem by FastQC.
In a library that covers a whole genome uniformly, most sequences will occur only once in the final set. A low level of duplication may indicate a very high level of coverage of the target sequence, but a high level of duplication is more likely to indicate some kind of enrichment bias (e.g. PCR over-amplification). Genes which are highly expressed will have a very high level of coverage in an RNA-seq experiment and we expect there to be a higher level of duplication than for a genomic library.
In our case it looks like our sequencing data is of high quality so we will move on. Close fastqc and proceed to the next section of the workshop.