Python is the name of a programming language (created by Dutch programmer Guido Van Rossum as a hobby programming project!), as well as the program, known as an interpreter, that executes scripts (text files) written in that language.
Van Rossum named his new programming language after Monty Python’s Flying Circus (he was reading the published scripts from “Monty Python’s Flying Circus” at the time of developing Python!).
It is common to use Monty Python references in example code. For example, the dummy (aka metasyntactic) variables often used in Python literature are spam and eggs, instead of the traditional foo and bar. As well as this, the official Python documentation often contains various obscure Monty Python references.
Jargon
The program is known as an interpreter because it interprets human readable code into computer readable code and executes it. This is in contrast to compiled programming languages like C, C++, and Java which split this process up into a compile step (conversion of human-readable code into computer code) and a separate execution step, which is what happens when you press on a typical program executable, or run a Java class file using the Java Virtual Machine.
Because of it’s focus on code readability and highly expressive syntax, meaning that programmers can write less code than would be required with languages like C or Java, Python has grown hugely in popularity and is now one of the most popular programming languages in use.
Added Bonus!
Due to it’s popularity, Python is available for all major computing platforms, including but not limited to:
- Windows
- MacOS - includes a version installed by default
- Linux - includes a version installed by default in many distributions
- Android - via several android apps e.g. QPython, Kivy, Pygame, SL4A.
- Plus Solaris, Windows CE, RISC OS, IOS (IPhone - via apps) and more
Now that we know roughly what Python is, why is Python of interest to us as researchers?
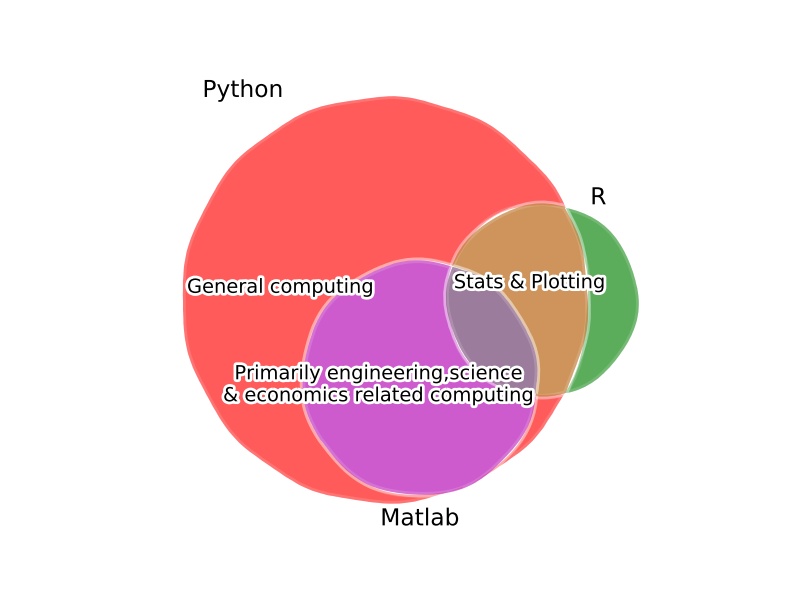
For users of specialist environments like Matlab, Stata, R, the answer might be because in most cases Python offers similar performance and range of functions, while providing a much wider range of additional functionality. Plus compared with Matlab or Stata, Python is open-source and free.

If you come from a low(or lower)-level computing background like C++, Java, Fortran, then Python is great at accelerating development and prototyping time. The ability to “glue” together routines written in Fortan or C++ at the programming level means Python offers the best of both worlds.
Lastly, if you’re not from either of these backgrounds, then let’s provide a sample of what you can do with Python for a typical research project:
As much as I think Python is a fantastic programming framework for many tasks, it’s important to pay attention to it’s limitations and possible scenarios when we might not want to use Python.
* An important note here though is that Python has several mechanism that allow integrating with compiled libraries; in fact most of the numerical computing functionality comes from compiled C-code! Matlab has similar capabilities via “MEX” functions (though to my knowledge the interface is a little more cumbersome). R also has similar interface functionality
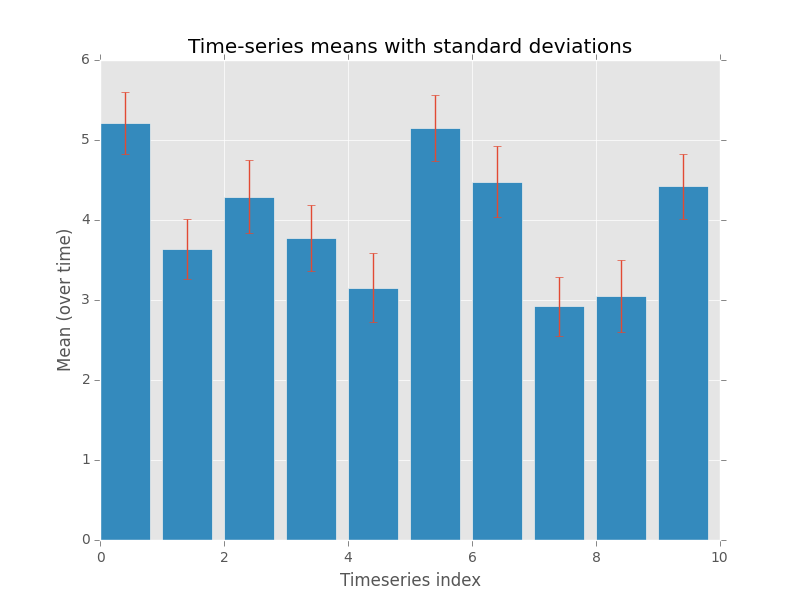
With just 13 lines of Python (plus comments), we are able to write a realistic script to loop over all CSV files in a folder (and subfolders), and generate a statistical plot for each one, including titles etc!

(“Time-series” generated using numpys random number generator).
Note: lines starting with a hash (#) are just comments - text useful for other developer and is not executed
In code:
# Modules we're going to use
import os, numpy, pylab
# Matplotlib's default style is a bit ugly, use the R's
# ggplot2-inspired style!
pylab.style.use('ggplot')

# "Walk" through the entire directory tree
for root, dirs, filenames in os.walk("/datapath"):
    # Work on csv (comma separated value) files
    for filename in filter(lambda f: endswith(".csv", filenames)):
        # Load 2d time-series data into an array using Numpy
        # (time is along 2nd dimension)
        data = numpy.loadtxt(filename, delimiter=",")
        # Get some stats
        means   = data.mean(axis=-1)
        stdevs  = data.std(axis=-1)
        stderrs = stdevs / numpy.sqrt(data.shape[-1])

        # Make bar plots with errorbars
        pylab.bar(range(data.shape[0]), means, yerr=stderrs)

        # Add in labels and title
        pylab.xlabel("Timeseries index")
        pylab.ylabel("Mean (over time)")
        pylab.title("Time-series means with standard deviations")

        # Save the plot as a PDF
        # in the data folder with a datafile specific filename
        pylab.savefig(os.path.join(root, filename + "_result.pdf"))
In addition, this was using general numerical libraries; with a specialist library like Pandas this could probably have been reduced further.
While these modules won’t be covered until the advanced sessions, these introductory sessions lay the groundwork for being able to use these modules.
Given a task like:
What I would like to do is read an xls file and see if any items in one column are also in a particular column of another xls file.
The real world issue is we get a daily data dump of FRUIT which have GONE BAD and I want to cross reference this against my FRUIT inventory. I can easily turn both into csv files of course. I started to write a script in Python, but have never found the extra 30mins or so I need to finish it.
How can we achieve this, and can we do so with just what we learn in this workshop?
The task turns out to have a simple solution, as well as some more concise approaches if we can use more advanced Python and/or modules.
#
# Simple Python Version
#
print("\n\nSimple Python Version")
# Open data files for reading
fin1 = open("data_sheet1.csv")
fin2 = open("data_sheet2.csv")
# Create empty lists to store contents and overlap
col1 = []
col2 = []
overlap = []
# Read in the files, discarding spaces and removing the comma
for line in fin1:
    col1.append(line.strip().strip(","))
for line in fin2:
    col2.append(line.strip().strip(","))
# Add an item in col2 to the overlap if it is in col1
for cell in col2:
    if cell in col1:
        overlap.append(cell)
# Show what the overlap items are
for cell in overlap:
    print(cell)
# Close the files
fin1.close()
fin2.close()

#
# More advanced Python Version A - order not preserved
#

print('\n\nMore "pythonic" python version -version 1 - order not preserved')
col1 = set(line.split(",")[0] for line in open("data_sheet1.csv"))
col2 = set(line.split(",")[0] for line in open("data_sheet2.csv"))
overlap_2 = col2.intersection(col1)
print("\n".join(overlap_2))

#
# More advanced Python Version B - order preserved
#

print('\n\nMore "pythonic" python version -version 2 - order preserved')
col1 = [line.split(",")[0] for line in open("data_sheet1.csv")]
col2 = [line.split(",")[0] for line in open("data_sheet2.csv")]
overlap_2 = [ cell for cell in col1 if cell in col2 ]
print("\n".join(overlap_2))

#
# Using modules version
#
print("\n\nModules version (using pandas)")
import pandas as pd
df1 = pd.read_csv("data_sheet1.csv", header=-1)
df2 = pd.read_csv("data_sheet2.csv", header=-1)
overlap_3 = pd.merge(df1, df2, how="inner", on=[0])[0]
print(overlap_3)
Given input data sheet 1
Apple,
Banana,
Mango,
Raspberry,
Blueberry,
Passionfruit,
Cherry,
Pear,
and sheet 2:
Mango,
Red Herring,
Cherry,
The whole script then produces the output
Simple Python Version
Mango
Cherry


More "pythonic" python version -version 1 - order not preserved
Cherry
Mango


More "pythonic" python version -version 2 - order preserved
Mango
Cherry


Modules version (using pandas)
0     Mango
1    Cherry
If you would like to run this example, you may download the data sheets from here:
data_sheet1.csv data_sheet2.csv
This course aims to teach you how to use basic Python including
if, for, while)We will not be delivering hours of lectures on programming constructs and theory, or detailing how every function of every module works.
For both environmental reasons and to ensure that you have the most up-to-date version, we recommend that you work from the online version of these notes instead of print-outs. However, while there are no plans to ever take these notes offline, you may wish to save them to PDF (via the print to PDF functionality) to safeguard agaist such an eventuality.
A printable, single page version of these notes is available here.
Please email any typos, mistakes, broken links or other suggestions to j.metz@exeter.ac.uk.
If you want to use Python on your own computer I would recommend using one of the following “distributions” of Python, rather than just the basic Python interpreter.
Amongst other things, these distributions take the pain out of getting started because they include all of the modules you’re likely to need to get started as well as links to pre-configured consoles that make running Python a breeze.
sudo apt-get install python3 from a terminal will install Python 3. Alternatively use Anaconda.Note : Be sure to download the Python 3, not 2, and get the correct architecture for your machine (i.e. 32 or 64 bit).